出版时间:2014.6
官网链接:O’Reilly
下载地址:百度网盘
内容简介:
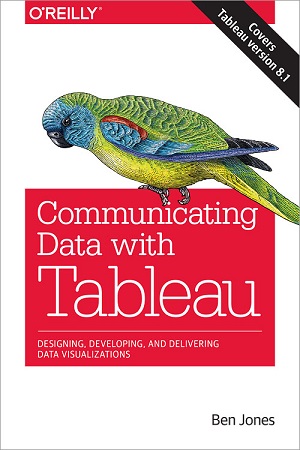
Go beyond spreadsheets and tables and design a data presentation that really makes an impact. This practical guide shows you how to use Tableau Software to convert raw data into compelling data visualizations that provide insight or allow viewers to explore the data for themselves.
Ideal for analysts, engineers, marketers, journalists, and researchers, this book describes the principles of communicating data and takes you on an in-depth tour of common visualization methods. You’ll learn how to craft articulate and creative data visualizations with Tableau Desktop 8.1 and Tableau Public 8.1.
- Present comparisons of how much and how many
- Use blended data sources to create ratios and rates
- Create charts to depict proportions and percentages
- Visualize measures of mean, median, and mode
- Lean how to deal with variation and uncertainty
- Communicate multiple quantities in the same view
- Show how quantities and events change over time
- Use maps to communicate positional data
- Build dashboards to combine several visualizations